 Voice and Singing in
Popular Music in the U.S.A. (1900–1960)
vocalmetrics
A web-Tool for exploring the popvoice
Concept and implementation:
Martin Pfleiderer, Tobias Marx, Tilo Hähnel, Inga Langhans (HfM Weimar)
Rainer Groh, Axel Berndt, Felix Schönfeld, Eva Brumme, Huong Nguyen (TU Dresden)
Version 1.0 (01.07.2013)
Start view (Overview):
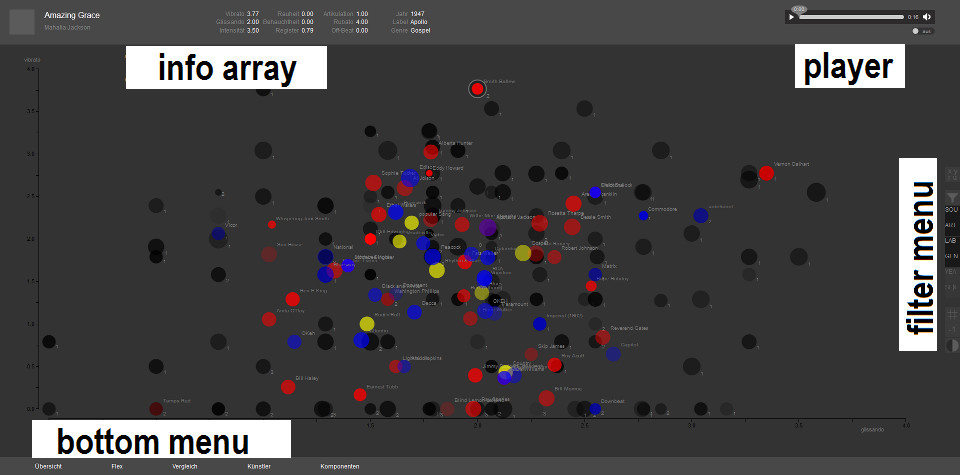
Each dot in the coordinate system represents an audio sample and shows four characteristics: Position relative to the two axes, size of the dot's radius and degree of it's transparency. Therefore, dots can represent four out of nine available vocal features at once.
Via the filter menue vocal features and meta data can be selected. Furthermore, it is possible to show mean values of vocal features for artists, genres, labels and sex.
Navigating the start view:
When hovering over the dots with the cursor, each audio sample's title and artist will be displayed.
When clicking on a sample, all data will be displayed in the info array. The corresponding sound file can be played back with the player.
Per right-click, spectrogram images and additional data can be accessed optionally.
Numbers next to dots specify how many samples share the same coordinates. If multiple samples share the same coordinates they can be selected via the mouse wheel.
Elements to operate the tool:
To operate the tool, four components are available:

|
The info array lists all feature characteristics and meta data of the selected dot.

return to top
 The player allows to play back the last selected sample.
If desired, auto play can be activated (on) and deactivated (off) via the switch below the player.
With activated auto play, selected samples will be played back instantly.
In some browsers (e.g. Firefox), the player itself might not be displayed.
With activated auto play, the samples can be played back nonetheless.
return to top
The bottom menu allows to switch between three possible views:
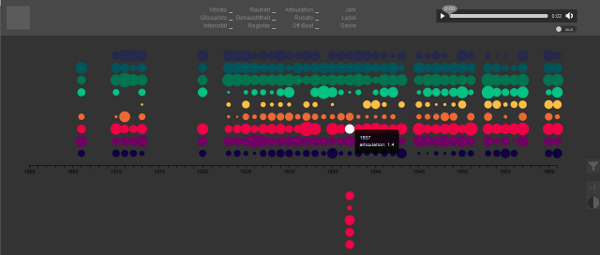
The Timeline view displays all mean values of vocal features per year within the time period of 1900 to 1960.

To examine the contributing samples of a year in detail, click on the respective dot. All relevant samples will appear below the coordinate system. Each audio sample can be loaded into the info array with a click and can then be played back.
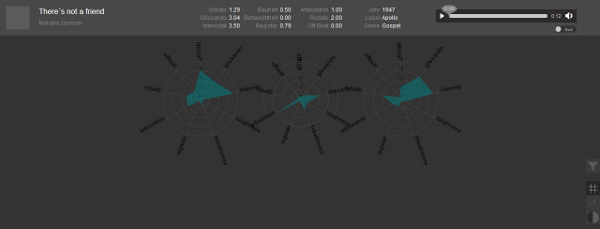
The Comparison view visualizes details for comparison of audio examples selected last.
The implemented radar view displays similarities and differences between all vocal features of the audio examples selected last. All nine vocal features are placed along a circle. Higher rated features are more distant to the circle centre. The combination of rated values result in an individual shape for each sample. Labels can be shown or hidden via the grid icon (#) in the filter menu.
return to top
The filter menu offers options for controlling the visualization.
Each view contains different filters:
|
|
The features icon allows to allocate features to axes (x, y), dot size (radius) and transparency (alpha). For selection click the button. First select the axis (x-axis or y-axis), radius or transparency and then choose a feature from the pop-up list. It can be useful to apply one feature twice, for instance, to dot size and transparency, which would result in modest salience in regard to low ratings due to smaller and more transparent dots. |
|
|
The ALL-Icon shows all samples. Each dot represents an audio sample. The number of dots sharing the same coordinates is indicated by a small number. |
|
|
The ART-Icon shows all vocalists (artists). Each dot represents the mean value of the selected feature referring to all corresponding audio samples. |
|
|
The LAB-Icon shows all music labels (record companies). Each dot represents the mean value of the selected feature referring to all corresponding audio samples. |
|
|
The GEN-Icon shows all genres. Each dot represents the mean value of the selected feature referring to all corresponding audio samples. |
|
|
The YEA-Icon shows the years. Each dot represents the mean value of the selected feature referring to all corresponding audio samples. |
|
|
The SEX-Icon shows both sexes. Each dot represents the mean value of the selected feature referring to all corresponding audio samples. |
|
|
The #-icon (Grid-Icon) shows a grid when applied in the start view and timeline view and the feature labels when applied in the comparison view and timeline view. Default is »off«. |
|
|
The »-1«-Icon inverts values of the dot size, resulting in low values to be displayed with large dots and vice versa. This can be useful when searching for low rated samples. Coordinates and transparency remain unaffected. |
return to top
last update: 20.10.2014
